I like elements which are hybrid rather than “pure,” compromising rather than “clean,” distorted rather than “straightforward,” ambiguous rather than “articulated,” perverse as well as impersonal, boring as well as “interesting,” conventional rather than “designed,” accommodating rather than excluding, inconsistent and equivocal rather than direct and clear.
— Robert Venturi 11 Robert Venturi, Complexity and Contradiction in Architecture (New York: The Museum of Modern Art, 1977), 16.
What is a city, and how can one draw it? Reduced to its essence, this twofold question preoccupies the authors of the majority of the books and maps I design. The goal of their research is to understand a spatial phenomenon and to develop techniques to handle it. The focus of my practice is the transformation of this architectural and urban research into a graphic format. As urban forms evolved over the past century into less defined entities they became more difficult to capture in a single definite image. During the same period, critical thinking highlighted the ambivalent nature of representation, especially of formats that profess to be observer independent, such as maps. Strategies to address and incorporate the ambiguity of representations have resulted in visualizations that are less easy to read. With the increased complexity of both definition and depiction, the questions of what a city is and how to draw it have become even more complicated to answer.
The Inevitable Rhetorics of Maps
A map is a product at the intersection of cartography and graphic design. It is both the outcome of a process that builds on the premise that reality can be modeled, as well as a graphically reproduced object that conveys a message to a user. According to the Oxford English Dictionary, cartography is the science or practice of drawing maps and the term is derived from the Greek khártēs, ‘papyrus leaf’, and graphē, ‘write.’ The focus of the field of cartography is the process of making maps. It deals with such issues as the editing of the traits of the mapped object, the projection of spatial information onto flat media and the elimination of characteristics to reduce complexity through generalization.
Critical cartography, an interdisciplinary field that emerged in the 1990s, is the study of the full scope of the map, both as the result of a process and as a communicative object. It differs from academic cartography in that it links geographic knowledge with political power. Its practitioners are geographers, architects, artists, planners and those who defy labels.22 MIT Sidewalk Laboratory, http://b-o.fr/critical-carto Critical cartography originated from the work of British geographer John B. Harley (1932–1991), who questioned the “scientific” or “objective” aspects of maps. He stated that cartographers manufacture power rather than objectivity.33 John B. Harley, “Deconstructing the Map,” in Writing Worlds: Discourse, Text and Metaphor in the Representation of Landscape, Trevor J. Barnes and James S. Duncan, ed. (London: Routledge, 1992), 231–247. Harley argues that mapmakers are ethically responsible for the effects of their maps. He sees seemingly neutral scientific mapping as a highly partisan intervention, often for state interests.44 John B. Harley, “Cartography, Ethics and Social Theory,” Cartographica, vol. 26 (1989), 1–2.
In their introductory text on critical cartography, geographers Jeremy W. Crampton and John B. Krygier describe two circumstances that resulted in cartography slipping from the control of the powerful elites, such as the great map houses of the west, the state, and, to a lesser extent, the academic world, that have dominated it for several hundred years.55 Jeremy W. Crampton, John B. Krygier, “An Introduction to Critical Cartography,” 2006, ACME: An International Journal for Critical Geographies, 4(1), 11–33. Digital technology, new mapping software, open source collaborative tools, mobile mapping applications and geotagging have all opened up the field of cartography and made it possible for the emergence of new mapping practices.The second event was the forming of a critique that highlighted the politics of mapping, with the aforementioned Harley as one of its key protagonists. According to Crampton and Krygier, the critical approach to cartography ‘undisciplined’ the field, freeing it from the confines of the academic and opening it up to a wider public. Until the digital age, maps were produced by those in power. Digital technology has created new cartographic tools that are easy to access. Technology thus empowered new players to enter the field who, with no prior knowledge of cartography, began to map different subjects in novel ways, occasionally resulting in new forms.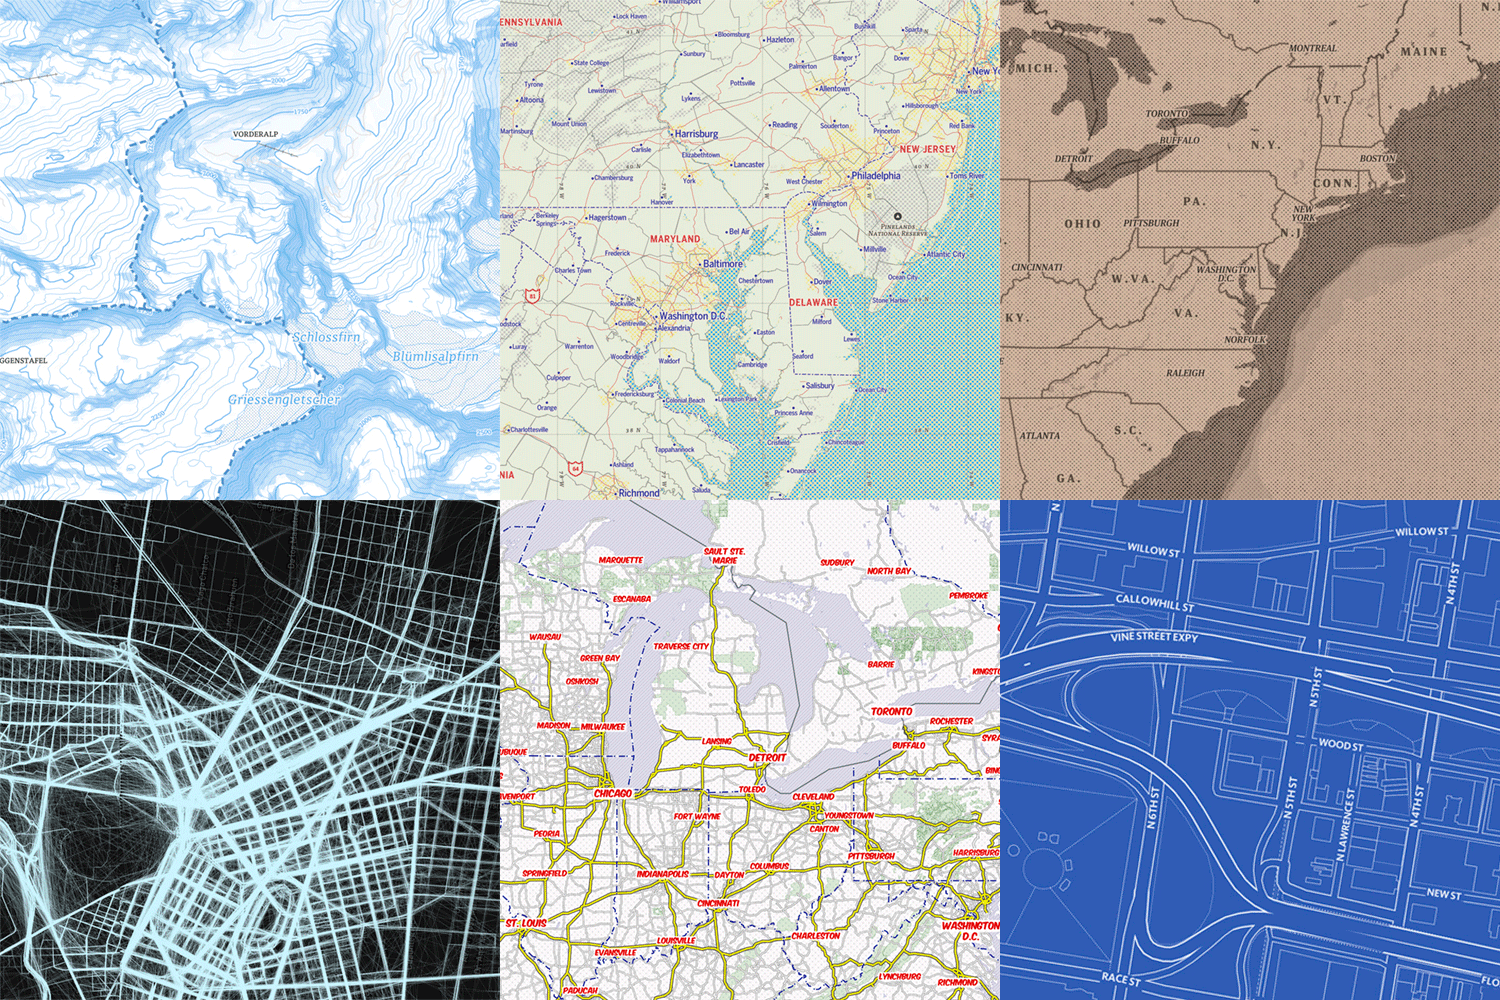
Similar to what happened in cartography, technological advances opened up the field of graphic design. Design has become an activity that can be done by anyone with access to a computer and software. Much the same as with the critical assessment of cartography, the field of graphic design began to question the modernist dogmas that had shaped the field. This resulted in an existential crisis about their responsibility and the role they played for some of its traditional practitioners. Just as is the case with any product of graphic design, maps are objects of power since they code their subjects and provide identity. When maps are made, data is filtered and a system of symbols is conceived: maps are designed, and design contributes to the manufacturing of power through maps.
Harley’s analysis of the internal workings of maps found that maps are never neutral: where they seem to be neutral it is the sly “rhetoric of neutrality” that is trying to persuade us.66 Harley, 1992, 247. This oxymoron demands further inspection. Rhetoric is the art of discourse or the capability to persuade a given audience in a specific situation. Designer, educator and writer Gui Bonsiepe showed that informative assertions are interlarded with rhetoric to a greater or lesser degree. Information without rhetoric is a pipe dream which ends up in the breakdown of communication and total silence.77 Gui Bonsiepe, “Visual-Verbal Rhetoric,” Ulm, nos. 14/15/16 (December 1965), 30. For the designer, “pure” information exists only as a sterile abstraction. As soon as one begins to give it concrete shape, to bring it within the range of experience, the process of rhetorical infiltrations begins. Bonsiepe claimed that there are products of information to be found that are “innocent of all taint of rhetoric,” citing train timetables or a table of logarithms as examples.
Harley’s use of the “rhetoric of neutrality” is a reference to the title of an article by publisher and writer Robin Kinross.88 Robin Kinross, “The Rhetoric of Neutrality,” in Design Discourse: History/Theory/Criticism, Victor Margolin ed., (Chicago: University of Chicago Press, 1989), 131–143. In this article Kinross raises doubts about Bonsiepe’s claim about the existence of products of information free from rhetoric. Kinross shows that typography—typeface, type style, rules, dot leaders, symbols, spaces—along with the use of color function as rhetorical devices in the design of train timetables and that there is no such thing as “pure” information. A rhetorical device in texts consists of the use of language that is intended to have an effect on its reader but does not take into account its literal significance. Repetition, figurative language, metaphors, alliteration and rhetorical questions are all examples of rhetorical devices. Kinross shows that all the tools of the designer, from typography to the use of color, may not change the content but do have a rhetorical effect on the user. To be able to define rhetorical effects in maps it is interesting to consider what a neutral map might look like. Neutral in the sense of being “innocent of the taint of rhetoric” (Bonsiepe), containing “pure information” (Kinross) and being “objective” (Harley). Such a map would be an unmanipulated reproduction of its original. The information would be unfiltered and as difficult to handle or read as the territory it is trying to represent. So much for neutrality, but, in order to manage and understand a map the information it contains needs to be manipulated. According to the Oxford English Dictionary, which defines a map as a diagrammatic representation of an area of land, this manipulation in mapmaking constitutes a simplification and schematisation.99 Oxford English Dictionary definition of ‘Map,’ http://b-o.fr/map
I would add “design” to this description and define a map as a designed diagrammatic representation of an area of land. Design in this case refers both to the outcome of a process aimed at improved communication and the result of a process of multiplication through graphic technologies. Making maps is a process of manipulating data. This transformation is essential to the cartographic process. Manipulation takes place when projecting a spatial reality onto a two-dimensional plane, in the selection of the orientation of a map, in its creation as a fixed rendering of a situation in flux, in its resizing of the original site into a smaller representation, in its showing a cutout version of reality, in its filtering of elements by selection or generalization, and in the addition of invisible elements like borders and height lines. A similar transformation takes place when a map is designed. The user is manipulated through the process of reproduction and multiplication: the choice of medium, physical qualities, the glow or shininess of a screen or the tactility and translucency of paper. Other factors include how a map is placed on a sheet or screen, whether it bleeds out, has a margin, or is in a composition with other elements, as well as the use of typography, the choice of reproduction technique, physical qualities of inks on paper, or the effect created by certain RGB values that produce more intense colors. Additionally, there are the effect of rasters, line weights and other characteristics of reproduction, the effects of information being organized in time, and whether the map is placed within a succession of information, such as in a book or a time-based medium. The manipulations inherent in the process of mapmaking will inevitably have rhetorical effects. Even if it is not the intent of the author or designer of the map, they will affect the user’s interpretation of the presented data. The question therefore should not be what does a neutral map look like but what can be done to make the map user aware they are being manipulated?
Visual theorist and cultural critic Johanna Drucker regards information visualisations as “intellectual Trojan horses” from the empirical sciences that suggest they are observer independent but are in fact interpretations masquerading as representations.1010 Johanna Drucker, Graphesis. Visual Forms of Knowledge Production (Cambridge MA: Harvard University Press, 2014), 125. According to Drucker we need to accept the fundamentally constructed nature of data and acknowledge that phenomena such as nations, genders, populations and time spans are not self-evident, stable entities. To rethink our approach to visualization and the assumptions that underpin it, Drucker calls for ambiguity and uncertainty to be incorporated in the design of information, either by representing it or by using it as the basis upon which a representation is made.1111 Drucker, 2014, 127. More concretely, Drucker calls for a map with a more nuanced legend or for a non-standard map that shows its quality as a construct. The need for a legend that expresses delicate distinctions is clear. Who would argue against this ambition for a map key? Drucker’s other stipulation is less apparent. How does one incorporate the qualities of being open to more than one interpretation and of being unresolved in the design of information?
The map, as a particularly restricted format, was highly affected by the democratization of the tools for the recording and editing of data. Smartphones with GPS technology and open source software to create and distribute information resulted in a larger community of mapmakers. As the group who could make them expanded rapidly, the amount of maps being made increased exponentially. Pinterest boards full of cartographic explorations attest to this development. Many of these maps can be labeled as non-standard as they are not in keeping with cartographic traditions. Most of the time this is due to ignorance of the standards of the field, which results in an illegible cartographic sludge or self-indulgent data pornography. Few of the examples of cartographic production by the new players question the format or force us to rethink the assumptions that underpin it, let alone make the map user aware they are being manipulated.
I would suggest a different approach based on the dichotomy between confirmation and questioning. One that takes the fundamental manipulations of a map as its starting point and challenges them. By introducing contradiction, the complexity of the cartographic construct will be revealed to the user. In my work a development can be seen towards this kind of ambiguous cartography. An evolution towards a map that questions itself, that follows an approach that prefers “both-and” to “either-or,” to quote architect Robert Venturi.1212 Venturi, 1977, 16. Initially this resulted in the use of specific inks, emphasizing that a map is both a representation of a physical reality and a material object in and of itself. Subsequently, various other aspects of maps were scrutinized in my designs. This process was intuitive at first, and later complemented by insights from theory, some of which are referred to above. Using the conceptual understanding I developed of the cartographic object and process I will revisit one of my projects with the goal of formulating the tactics of ambiguity in map design.
A Land Never
In 2012 I was a member of the curatorial team of the Belgian Pavilion at the 13th Venice Architecture Bienniale.1313 The curatorial team named themselves AWJGGRAUaDVVTAT, an acronym of the names of its members Architecture Workroom Brussels (BE), Studio Joost Grootens (NL), urban design studio GRAU (FR), architects De Vylder Vinck Taillieu (BE), and artist Ante Timmermans (BE). We developed the exhibition The Ambition of the Territory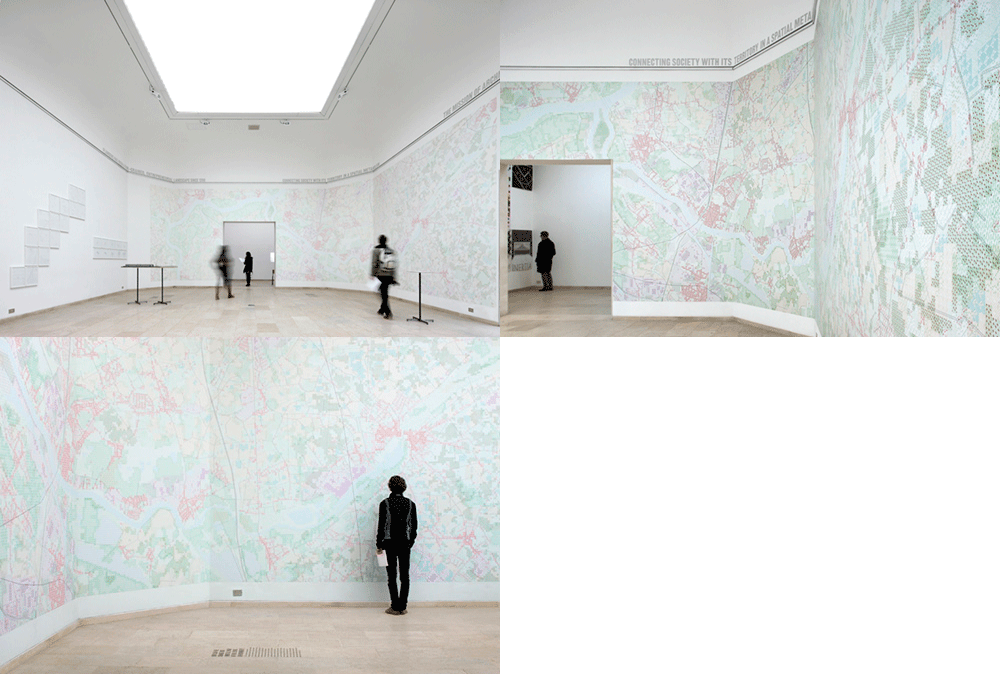 which focused on the drawing and redrawing of the territory of Flanders. The extreme urbanization and intensive diversity and density of this northern part of Belgium has resulted in a dispersed horizontal mix of small-scale functions and programs.1414 Architecture Workroom Brussels, The Ambition of the Territory, Belgian Pavilion, Venice 2012. http://b-o.fr/venice Where most planning practices try to divide open space into clearly demarcated areas for living, industry and nature, The Ambition of the Territory recognizes a quality in the suburban and fragmented open space nature of Flanders that could be a starting point for developing a sustainable and prosperous society. The maps, models, photographs and drawings in the show present Flanders as a complex of complementary, transnational and autarkic metropolitan regions.
My contribution to the exhibition was a map titled A Land Never,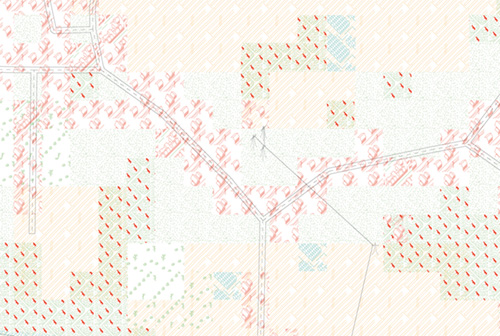 an anagram of the Dutch word for Flanders, showing a 30 × 8 km area south of Antwerp, between Temse and Lier. The map showed in detail the diversity of functions and the proximity of various users in this “in-between” city. The map in scale 1:2000 measured 15 × 4 m. The reasoning behind making such a big map was that making a small one would not show the reality I had experienced when visiting this part of Belgium. A typical small scale map of Flanders shows a network of cities, connected by infrastructure, with seemingly nothing in between. Unlike this cartographic representation, traveling through the region feels like seeing a perpetual soup of the same type but in slightly different configurations—a continuous mix of habitat, industry, agriculture, nature and infrastructure. A small map would not show this aspect of Flanders. The eventual size of the map was the outcome of a choice in the scale and the architecture of the pavilion. 1:2000 was chosen as it is a scale that is between architecture and urbanism, resulting in a feel between building block and coherent city shape.1717 The scale 1:2000 is between that of a site plan (approximately 1:500), which depicts a building in relation to the structures that surround it, and an urban plan (approximately 1:10,000), which shows aspects of land use and infrastructure. In scale 1:2000, one centimeter represents twenty meters. The house I live in measures 15 × 5 m: on a 1:2000 map it is depicted as 7.5 × 2.5 mm. This would show the finely grained texture of functions so typical of the Flanders region.
The map was placed vertically to provide visitors with an overview of the total image while offering the possibility of moving in closer to see its details. It was my intention for it to become one with the architecture of the pavilion. Not placing it as an object on a wall but blending it with the architecture, making it a wall itself; the equivalent of setting a photograph to bleed off a page in a magazine. This made the map feel less formal. Unlike the large maps in the Scudo Room of the Doge’s Palace in Venice, I did not want the Flanders map to look like an object of power. The map was made into a backdrop that was wallpapered onto the inner façade of the pavilion’s central room, around a corner onto an adjacent wall, incorporating a doorway that cut out a part of the map. The missing fragment highlighted its incompleteness. The doorway also meant that visitors would see the map up close when crossing from one space to another. Many visitors could be found scanning the maps at close range, nearly touching the wall.
The cartography was developed so that one would understand it without having to study a legend. A separate map key was omitted altogether as were any textual clues. To understand the map one had merely to look. The legend was figurative and consisted of isometric illustrative patterns. The small grained texture of various functions of Flanders resulted in an layering of these patterns. The activities were distinguishable by the complexity of overlapping illustrations. A 50 × 50 m grid was chosen to filter the geo-referenced data on land use. On the 1:2000 map this created a 25 × 25 mm tile pattern. From afar this relatively large raster size seemed pixelated, digital, and abstract. From up close however, the illustrations seem hand drawn, naive and figurative.
A similar contrast between an overall image and the graphic elements that constitute it can be seen in Stadtbild F, a 1968 painting by Gerhard Richter.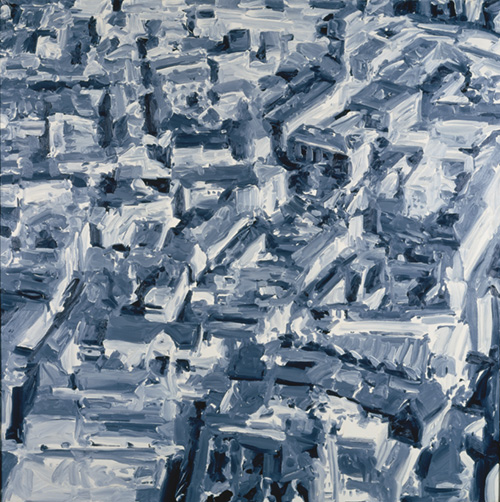 This 2 × 2 m black and white painting is reminiscent of the aerial photography of postwar bombed-out cities. It appears to have been painted quickly as many details vanish due to the gestural and pastose application of paint. From a distance the image can easily be identified as a cityscape. However, if one moves closer to the painting, the depiction dissolves into expanses and strokes of white, grey and black. From a distance the image looks whole, complete and constructed, from up close one sees the chaos, roughness and violence of matter.
The illustrations in the legend of the Flanders map were in isometric projection, a method for visually representing three-dimensional objects in two dimensions, a so-called anti-perspective in which the three coordinate axes are equally foreshortened.1818 Massimo Scolari, Oblique Drawing: a History of Anti-Perspective (Cambridge MA: MIT Press, 2012). Popular computer games like Sims (2000), The Simpsons: Tapped Out (2012) and Crossy Road (2014), and digital map tools like Google Earth (2005) and the flyover mode of Apple Maps (2012) all use isometric projection. The projection method has also been used to a large extent in architectural discourse. For the legend of the Flanders map the isometric illustrations were simplified by removing some of the lines. This made overlapping layers of illustrations in the map less complex to read. As the map consisted completely of line drawings I made sure that the CMYK inkjet printer used for its production always used one of the cyan, magenta or yellow inks at 100% and avoided color recipes that contain black ink. Not having C, M, Y or K in 100% would result in rasterized lines that would look blurry. I made the lines sharp as I wanted to be unambiguous about my ambiguous intentions.
Ambiguous Tactics in Map Design
Like any artistic endeavor, designing the Flanders map was a partly intuitive and partly reasoned process. The analytical reading described above is the outcome of reflections over time, informed by further experiences and theoretical knowledge, thus resulting in the insights on the rhetoric of maps as described in the introduction of this text. In a workshop with a group of students from KADK Copenhagen’s Master Urbanism and Societal Change the cartography of the Flanders map was developed further. The resulting map of greater Copenhagen was used to test out scenarios of rising seawater levels. Compared to the Flanders map, a larger scale was chosen in order to show a finer urban grain, befitting the qualities of the mapped territory. Certain parts of the Copenhagen map were drawn in much more detail, as part of the display in an exhibition. These parts could be accessed by looking through Fresnel lenses,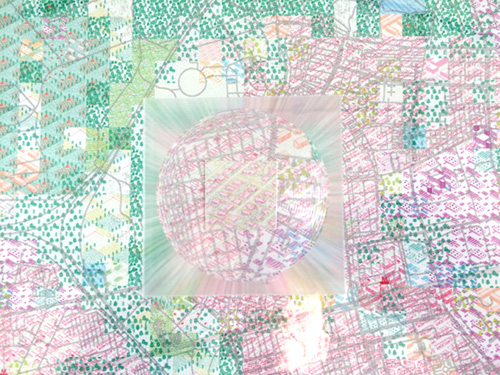 highlighting the map as product of a process of manipulation.
A map is a representational construct. Ambiguity is a persuasive tactic to make the user aware of the inevitable rhetorical effects in play. This can be done by a dichotomous approach of challenging and reinforcing the fundamental manipulations that take place in the construction and production of maps. Processes of projection, orientation, fixation, resizing, cropping, filtering, generalization, materialization, composition, lettering, organization and reproduction are essential transformations in the cartographic representation of a spatial phenomenon. These can be questioned by a “Both-and” approach of incorporating contrasts like show/hide, graphical/physical, abstract/figurative, digitally produced/handmade, and 3D/2D.
An ambiguous approach to cartography feels like an appropriate language to describe phenomena that are indefinite, unstable entities like ecology, nations, genders and humankind itself. Especially at a moment when society is in a representational crisis now that the modernist tropes of simplicity and clarity have been hijacked by commercial enterprises and the populist right to sell goods and ideas. Acknowledging the rhetorical nature of maps will also challenge the mapmaking process. The design of a map is not necessarily a sequential activity following its recording and editing. It can be seen as a parallel process or even the starting point that revolves around fundamental questions, such as how does one draw a city, and what is its definition?